



Where does the data come from?
CEMD (The Center for Education Market Dynamics) is a nonprofit K–12 education market intelligence organization that works to improve educational outcomes by expanding the adoption and use of high-quality instructional materials. CEMD collects selection data for math, ELA, science, and social studies through district and state websites, direct communication with districts, and other publicly available sources.
For California, the Dashboard combines CEMD’s instructional materials data with survey responses and district feedback collected through CalCurriculum and UnboundEd workshops and engagements.
How often is the dashboard updated?
CEMD refreshes its nationwide materials collection annually by academic year. CalCurriculum district surveys are conducted twice each year to help keep the information current. The California Dashboard is updated quarterly as new district information, survey responses, and verified updates become available.
My district’s information needs to be updated. How do I flag it?
We welcome updates from districts. If you notice outdated or incorrect information, please use this form to share updates to your district’s information. You can also use the form to learn about CalCurriculum Adoption Workshops and other UnboundEd professional learning opportunities.
Thank you for helping us keep this information accurate and up to date.
Does the dashboard recommend curricula?
CalCurriculum is a free, unbiased public resource. The dashboard does not rank, recommend, or endorse any publisher or program, it exists to give California’s education community a transparent view of the adoption landscape.
How are the Instructional Priorities determined?
The Student, Teacher, and District Priorities reflect insights gathered through four years of CalCurriculum partnerships with California districts navigating math materials adoption. Drawing on pre- and post-engagement survey data, the framework captures recurring priorities related to student learning, teacher practice and support, and district-level decision-making. An accompanying rubric supports consistent interpretation and application of these priorities and was informed by the UnboundEd Curriculum Adoption and Launch Cohort Guidebook.
What are Partner Districts and Spotlight Districts?
Partner Districts: Districts that have participated in an engagement, cohort, collaborative, or workshop facilitated by CalCurriculum or UnboundEd.
Spotlight Districts: Partner Districts that have participated in at least one engagement, cohort, collaborative or workshop focused on district insights, curriculum piloting, or the adoption of high-quality instructional materials, and who have given permission to be featured in the Dashboard.
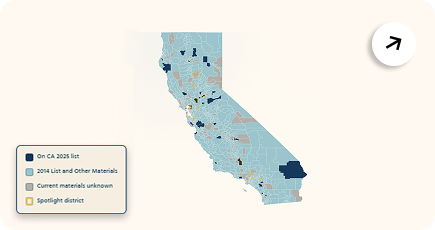
What do the various colors represent on the map?
The Dashboard is designed to showcase districts’ materials selections. The colors indicate three distinct categories of current materials:
- CDE 2025 Mathematics Instructional Materials Adoption list,
- CDE 2014 Mathematics Instructional Materials Adoption list and/or other materials, and
- Unknown
The yellow outline indicates Spotlight Districts, which are Partner Districts of CalCurriculum, through participation in at least one engagement, cohort, collaborative, or workshop focused on district insights, piloting, or the adoption of high-quality instructional materials.

Does the size of the districts on the map represent district size?
The district map comes from the GeoHub, an online data sharing platform that provides the public and researchers with access to the California Department of Education’s (CDE) mapping resources. The California school district composite layer includes elementary, secondary and unified school district area boundaries for the 2025-26 academic year supplemented with district-level demographics from the CDE data collections. The map is derived from GIS geographical boundaries and does not represent district size based on student population.
Are Trends and Signals product rankings?
No. Trends and Signals identify themes and patterns observed across aggregated data; they do not rank, rate, endorse, or compare individual products. They are intended to highlight broader developments within the instructional materials landscape rather than indicate that one product is more effective or preferable than another. The dashboard does not rank, recommend, or endorse any publisher or program.
How were the categories for Student Population: Total Enrollment, and English Learner Percentage identified?
The category ranges used for Student Population: Total Enrollment and English Learner Percentage filters are based on classifications established by the State of California. These state-defined categories provide a consistent framework for organizing and comparing district data within the Dashboard.
How were Piloted Materials identified and defined?
Piloted materials were self-selected and reported by district leaders based on the instructional materials their districts piloted. The pilot window refers to the school year during which the pilot window occurred and does not imply a specific scope for any pilot. Because pilot structures vary by district, we are unable to report details such as selected modules or duration of any pilot.